Sunday, 29 November 2020

What In the World - Part Trois

Yesterday we saw that Ontario was under the Canadian Covid-19 average rate for November.

But let's drill in on it anyway.  Because;

  1. even though it is under the national average, there are some bad offenders there,
  2. it is the largest province in Canada, and
  3. it's the only province I have data for.
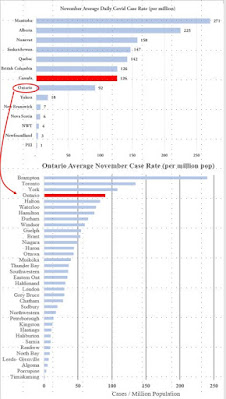
So......this chart drills down from the Canadian chart to individual regions in Ontario.  [As always, click on any graph to zoom in.]

Not surprisingly, the three largest areas (Toronto, Brampton and York region) are at - and have always been at - the top.

And at 240, that puts Brampton almost up there with Spain.  Spain!  But it's still not as bad as Manitoba.

And at 135, that puts Toronto.....just over the Canadian average for November.

What?!  How can that be?  Arnotti fact checkers are scratching their heads.

Well, that means that while everyone has been pointing, no wagging, fingers at Toronto, it is really lots of other places that have been driving Canada's rate (below) sky high.


Remember when we were freaking out back in April when we first went over 2,000 cases in one day?

Ah, good times. 

Well, maybe we just need to wait this out.  That's probably the wise choice.....


Saturday, 28 November 2020

Canada, Eh?

So yesterday we looked at the global view of Covid in November. Canada was just above the global average.

But who is making us Canukleheads look so bad on the world stage? 

Let's find out - this chart drills down from yesterday's global chart to the Canadian provinces.  You will definitely need to click to zoom in on this one. 

Manitoba.  I knew it!

And Alberta - I also knew it!

In fact, it looks like all of western Canada - all the former finger wagging, golden boys of how to do Covid right - are responsible.

Ontario - who if you read the Toronto Star must be run by Neanderthals - is actually below the Canadian average.

Manitoba, if you look on the top chart (you didn't double click, did you...) ranks right up there with Spain.

Interesting that the farther east you go, the lower the Covid rates.


Well, the eastern provinces had their "Atlantic Bubble", of course, and that looks like it worked pretty well. Remarkably well, in fact.

Of course the trick was simple - keep everybody "from away"    away.


Friday, 27 November 2020

What In The World - Part Deux

As a change from navel gazing, let's pull up to 30,000 feet and see was the rest of the world is doing, Covidwise.   [As always, click on any graph to zoom in.]


This chart shows the daily Covid case rate (per million souls) for essentially the month of November.

It is very similar to the last global view, below, in that Europe dominates all the top spots.  In this case 12,  except this time the US has now muscled in to the top ten.

And Canada is still about the same % above the global average.  And, of course, China is - still - at 0.


So I guess everyone needs to continue to social distance.

Maybe we could take a lesson from some in the animal world about associating with only those in your own household.


Thursday, 26 November 2020

Tuesday, 24 November 2020

I Didn't See That Coming

Just when you think some regions must be doing something right when it comes to Covid-19 - Wham! - they fool you.

Originally in Canada, Quebec was the bad boy (#1).   [As always, click on any graph to zoom in.]


British Columbia and Alberta were Mom's favourite kids (red and blue lines) and were always snitching on big brothers Quebec & Ontario. 

But in the middle of summer (#2) blue line Alberta stubbed its toe.  And by late summer (#3) that insufferable British Columbia had joined them - both with higher case rates than the troglodytes in Eastern Canada.

And now (#4) Alberta has completely lost it and BC and Quebec are not far behind. 

And unconceivably - if you listen to the Ontario media and medical authorities - Ontario has the lowest case rates.

But what about the rest of Canada?  One area stand outs.

For Covid, many regions have lots of it. and many other regions (below) had low case rates.


But rather than lots of it, one in particular had gone several months with none of it.

And that would, of course, be Nunavut (green line  at bottom and red on the map).  Canada's newest and most northern territory.

And then in the Covid race, as they were rounding the corner on final final turn, here comes Nunavut!


Nunavut got all of it.


In the last two weeks, Nunavut, with a population of 38,000, has now the highest case rate in Canada.

And check the scales on on the last graph with the ones from the large provinces.

Much, much, much higher rates.

I think we should send a few Toronto Star reporters up there to poke fingers in their faces.  And give the rest of us a break.


Saturday, 21 November 2020

State Your Cases(s)

Holy cow isn't nearly strong enough to describe what is going on south of the 49th parallel.

Here is the four-day Covid-19 case rate for the US. [As always, click on graph to zoom in.]


So Wyoming has a four-day Covid rate of 7,000 cases per million population.

What that means in terms the Arnotti Thoughts team can understand is that nearly 1% of Wyoming's population was infected in the last four days.

Same thing for North Dakota.

Iowa, Montana and Wisconsin have had half a percent of their population infected over those four days.

So much for the Covid thrives in density theory.

In Canada, it seems we are also out of control. Specifically Ontario and Toronto.


So no fooling around here.

As opposed to a major part of the US, Toronto has been completely locked down.  All restaurants and bars, and gyms & movie theatres have been shut.  Even patios have been shuttered. 


So how bad is Ontario & Toronto?

Well, look down on that chart.  Way down.  Way down there in red.

Ontario is about 350. Toronto (not shown) is around 450.

So who's zooming who?

Is Ontario overreacting or is a US stubbornly defiant?

 Probably a bit of both.

So do you cower inside or go on with your life....


...or carry on and take reasonable precautions?


Thursday, 19 November 2020

The Same, But Different

As Toronto is in Covid-19 lockdown, no indoor dining is allowed at restaurants.  

So whereas in Toronto bar owners are pulling all their patio heaters out of storage to protect patrons from the elements...


...some even resorting to tents.....


...bars in south Florida have the same, but different problem.

To keep patrons comfortable outdoors, they need to blast freezing air at them...


...using honking big industrial scale air conditioners.


Those bad boys can blast out the chill, baby.

So two countries, one problem, two totally different solutions.

And speaking of two countries, on a same, but different topic. [Click to enlarge.]


I would not have guessed a many of them.  

Not one European country.


Sunday, 15 November 2020

What In The World Is Going On?

 ...with Covid-19?

Well let's take a look a yesterday's world one-day case rate (per million population).  [Click on any graph to see how your country is doing!]


There are some countries that were on fire yesterday.  And likely the day before that. too.

The most impacted seem to be smaller places; Luxembourg,  Montenegro (where is Montenegro?), Georgia (where is Georgia?), Slovenia (where is...never mind).

But also some larger, mainly European, countries as well; Austria, Poland, Portugal, Italy, Hungary. 

One surprising omission is Spain.  No, it's there, but right at the bottom, at zero.

Very suspicious.  Right down there with China, also at zero.  But that is not suspicious at all, as I suspect the Chinese government reads my blog.  Why wouldn't they!

The US (dark blue) is right behind Europe, although if you listen to their media, you'd think they would be right at the top.

And Canada (red) is well down the list. Although if you listen to their media, you'd think they would be right at the top, too!

So what does it mean that Luxembourg had a one-day rate of 973?

Well, that means 0.1% of their population was infected.  In one day.

In contrast, Canada has had 0.8% of its population infected.  Since the start of the pandemic!

What does it all mean?  Who knows.

But what I do know is that most of Canada's 0.8% live pretty close to each other...


Wednesday, 11 November 2020

Where Were We....?

 Oh yeah, Biden won.

Enough of all that.  Let's talk about something less depressing.

The coronavirus!

So it has been busy in Canada while we were distracted.  [As always, click on any graph to zoom in.]


And Ontario has certainly been no slacker.


But virtually all regions have been solid contributors.


In fact, this view doesn't make Ontario look like a slacker.

But you'd never know that the way to Ontario media and public health officials wail about it.  Well, Toronto public health officials anyway. 

So let's look at Toronto, after the aforementioned Toronto public health officials strong-armed the government into shutting down bars, restaurants, gyms and movie theatres.


Looks like closing the bars and restaurants really worked!

In fact, it worked so well, they are going to extend the closures for another month.


Do you think maybe it could be something else?  And that closing the staffed and monitored restaurants have driven people indoors.  

To private parties where no one looking.

Or, could it be places where small, germ and disease ridden individuals ignore all rules - schools!

Okay, let's turn to something more important;  Remembrance Day.  A day to reflect on the sacrifices other heroes have made.

[This is an American poster, so gets a little political, but the sentiments still ring true.]


Friday, 6 November 2020

Finally! The US Election Decided!

Just kidding.  Of course it's not.

It's still a mess.


But is it getting closer? 

Here's a closer look.  [As always, click to zoom in.]


Major points;

  • Biden still leading in Nevada, but they are still counting votes.  Still?   What, is there like three guys counting?
  • Trump still leading in Pennsylvania, but his lead has shrunk (is shrinking) dramatically, as more mail in ballots are counted.  And the Biden team feels the remaining ballots are in Democratic strongholds. Plus they just printed off and delivered a whole bunch more.
  • Georgia is the biggest shock. On election eve, Trump had a comfortable lead.  Now - they are now virtually tied, as more mail in ballots are counted.  In fact, Biden has a slight lead. I guess Democrats like the mail-in.
So...tune in tomorrow.

But before that, here is a US map showing two equal population groups.


The orange areas have the same population as the red.  If the orange was blue, could be mistaken for a Democratic/Republican voting map.

Shows how divided the US is.


[Post Script 9am;  Joe Biden has now taken the lead in Pennsylvania.]


Thursday, 5 November 2020

When We Last Spoke......

 ...the US election was in gridlock.  


No clear winner, but both Biden & Trump had a clear path to victory.  Although with the way undecided states were leaning, Trump had the clearer path.

24 hours later things have clarified.  Somewhat.

Some states have gone final, giving Biden a commanding lead.  

And if one of the remaining five go Blue - and he is leading in Nevada - he will be the next President.

Let's look deeper at a couple of those, starting with Nevada.


Biden has a very slim lead, but with only 75% of the votes counted.  A nation's eyes are on you.

What's up with the 75%?   I don't think little old Nevada, with their six votes, has ever had the national spotlight on them before.

But if Florida - the eternal basket case for messed up elections and with a population seven times that of Nevada - can get all their votes counted by 9pm of election day, what's wrong with Nevada?

It's not like they're not familiar with counting stuff, with Las Vegas and Reno in that state. So that state could swing to Trump.

The other two interesting states would be Pennsylvania and Georgia. 

Trump has the lead in Pennsylvania, but not nearly as large a lead as yesterday.  As the infamous "mail-in" ballots are now being counted.

And for whatever reason, a lot of them are from the Phillie area.  Which traditionally votes about 80% Democrat.


So even though Trump has a 160,000 vote lead right now, there are still over 750,000 votes to be counted.

So let's do the math on the 750,000 votes with the Dems taking 80% of them......


...and, Sweet Mama Lama, Biden now has a 300,00 vote lead.  And takes Pennsylvania's 20 votes.  And the Presidency.   Don't even need to talk about Georgia.  And their fine, sweet peaches.

Trump is not going down with a fight, of course, and is contesting the results in several states.

So stay tuned......


Wednesday, 4 November 2020

You'll Only See It Here!

The US election is still not decided, but the crack Arnotti Thoughts research team is going to lay out all the options for you.

Here is the current situation as of 8am Wednesday.


The theme of the night was "too close to call!".

You need 270 electoral votes to win.  Blue states have gone for Biden (238) and Red for Trump (213).

There are seven states undecided.  With two leaning Biden (light blue) and five leaning Trump (pink).

If these leads hold, here is how things look.....

What?!?!

Trump can win?!

I can hear heads exploding all over.  I don't really care, but I don't want to listen to the media, Hollywood types and basketball players cry and wail for four more years.

Okay, take a deep breath. What is some of the Trump leaning states go for Biden?  Maybe Pennsylvania, where Biden campaigned exclusively last week?


Ta dah!!  Biden wins!  The sun will continue to shine!

But, before breaking out the responsibly sourced mineral water, let's see how close Pennsylvania is to flipping to blue.

I'm now adding in the current vote percentages and differences.....


Trump has a huge lead in Pennsylvania.  Almost 13% more than Biden, representing more than 600,000 votes!

Now, only two thirds of the votes have been counted here.  Ahhh....the mysterious "mail in ballots".

Okay, another scenario.  What if Trump wins Pennsylvania (he does have a huge lead) but Michigan flips blue (by far the closest race)?

Hold on to your bonnets.


270!    Biden wins.  

So Michigan is the state to keep your eyes on.

But you know - either way - there will be lawsuits.....


You'll only get it here, folks.


Tuesday, 3 November 2020

Forever Blue.....?

Prediction: No Republican will ever be elected President of the United States again.

Bold, you say?

No.  It is for one reason.


This map shows how states often vote, with Democratic states in blue and Republican states in red.

What is happening is that Democrats are fleeing high tax/high cost Democratic states, like California and New York and moving to Republican states like Texas (& Arizona) and Florida, respectively.

Why does that matter?

Well, California will always be Democratic, but if enough of them flee to Texas.....

....they still vote Democratic and will shift the balance of power away from a traditionally solid Republican state.

Ditto for New Yorkers fleeing for Florida.


So if Texas and Florida flip to Democratic, the Republicans are doomed; the math cannot work for them to get to 270 Electoral votes. 

And we may see the this impact this election, if Florida turns blue.

The irony of this is Democrats are fleeing the high taxes and high costs that their Democratic policies drive.  Only to bring their Democratic ideas with them to their new homes.

And it's driving Texans nuts.


Anyway, US politics - best spectator sport in the world.