Thursday, 5 November 2020

When We Last Spoke......

 ...the US election was in gridlock.  


No clear winner, but both Biden & Trump had a clear path to victory.  Although with the way undecided states were leaning, Trump had the clearer path.

24 hours later things have clarified.  Somewhat.

Some states have gone final, giving Biden a commanding lead.  

And if one of the remaining five go Blue - and he is leading in Nevada - he will be the next President.

Let's look deeper at a couple of those, starting with Nevada.


Biden has a very slim lead, but with only 75% of the votes counted.  A nation's eyes are on you.

What's up with the 75%?   I don't think little old Nevada, with their six votes, has ever had the national spotlight on them before.

But if Florida - the eternal basket case for messed up elections and with a population seven times that of Nevada - can get all their votes counted by 9pm of election day, what's wrong with Nevada?

It's not like they're not familiar with counting stuff, with Las Vegas and Reno in that state. So that state could swing to Trump.

The other two interesting states would be Pennsylvania and Georgia. 

Trump has the lead in Pennsylvania, but not nearly as large a lead as yesterday.  As the infamous "mail-in" ballots are now being counted.

And for whatever reason, a lot of them are from the Phillie area.  Which traditionally votes about 80% Democrat.
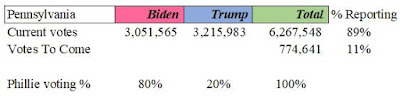

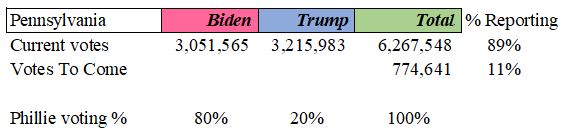
So even though Trump has a 160,000 vote lead right now, there are still over 750,000 votes to be counted.

So let's do the math on the 750,000 votes with the Dems taking 80% of them......


...and, Sweet Mama Lama, Biden now has a 300,00 vote lead.  And takes Pennsylvania's 20 votes.  And the Presidency.   Don't even need to talk about Georgia.  And their fine, sweet peaches.

Trump is not going down with a fight, of course, and is contesting the results in several states.

So stay tuned......


Wednesday, 4 November 2020

You'll Only See It Here!

The US election is still not decided, but the crack Arnotti Thoughts research team is going to lay out all the options for you.

Here is the current situation as of 8am Wednesday.


The theme of the night was "too close to call!".

You need 270 electoral votes to win.  Blue states have gone for Biden (238) and Red for Trump (213).

There are seven states undecided.  With two leaning Biden (light blue) and five leaning Trump (pink).

If these leads hold, here is how things look.....

What?!?!

Trump can win?!

I can hear heads exploding all over.  I don't really care, but I don't want to listen to the media, Hollywood types and basketball players cry and wail for four more years.

Okay, take a deep breath. What is some of the Trump leaning states go for Biden?  Maybe Pennsylvania, where Biden campaigned exclusively last week?


Ta dah!!  Biden wins!  The sun will continue to shine!

But, before breaking out the responsibly sourced mineral water, let's see how close Pennsylvania is to flipping to blue.

I'm now adding in the current vote percentages and differences.....


Trump has a huge lead in Pennsylvania.  Almost 13% more than Biden, representing more than 600,000 votes!

Now, only two thirds of the votes have been counted here.  Ahhh....the mysterious "mail in ballots".

Okay, another scenario.  What if Trump wins Pennsylvania (he does have a huge lead) but Michigan flips blue (by far the closest race)?

Hold on to your bonnets.


270!    Biden wins.  

So Michigan is the state to keep your eyes on.

But you know - either way - there will be lawsuits.....


You'll only get it here, folks.


Tuesday, 3 November 2020

Forever Blue.....?

Prediction: No Republican will ever be elected President of the United States again.

Bold, you say?

No.  It is for one reason.


This map shows how states often vote, with Democratic states in blue and Republican states in red.

What is happening is that Democrats are fleeing high tax/high cost Democratic states, like California and New York and moving to Republican states like Texas (& Arizona) and Florida, respectively.

Why does that matter?

Well, California will always be Democratic, but if enough of them flee to Texas.....

....they still vote Democratic and will shift the balance of power away from a traditionally solid Republican state.

Ditto for New Yorkers fleeing for Florida.


So if Texas and Florida flip to Democratic, the Republicans are doomed; the math cannot work for them to get to 270 Electoral votes. 

And we may see the this impact this election, if Florida turns blue.

The irony of this is Democrats are fleeing the high taxes and high costs that their Democratic policies drive.  Only to bring their Democratic ideas with them to their new homes.

And it's driving Texans nuts.


Anyway, US politics - best spectator sport in the world.


Sunday, 1 November 2020

Take A Breath

 As the media and public health officials in Canada continue to hyperventilate about our rising Covid case counts....


...and they definitely do look like they are going to infinity...and beyond....

...but to provide some global context let's take another look at the rest of the world.

This is the same global chart from last week, updated with this week's information.  

The blue line is the current week's 7-Day Covid case rate and the orange is last week's. 

[Double click to zoom in.]


Conclusions?

The whole world is on fire!  

In almost every case, the blue bar is longer than the yellow bar.  And in some cases, much longer (except for China, of course, which remains at zero).

Belgium looks to be exploding.  Or imploding.  Their case rate has jumped from 800 to 1,740.  In just one week.

In contrast, Canada (#24 in your programmes) has gone from 58 to 78. 

Czechia, Netherlands, Poland and France are not far behind Belgium in how their case rates have exploded in the last week.  So I guess it is not just Trump who has monumentally bungled the pandemic, if you listen to the US media.

The US has gone from 180 to 250 in the last week.

So take a deep breath, keep your distance social and your stick on the ice.  And carry on.


Saturday, 31 October 2020

Called It!

As this site hypothesized a few days ago (hypothesized only, no conclusions, as no testing was done, which is the basis of the scientific method!) "We use science" is the new "You're a racist" to shut down debate.  And bars & restaurants.


This site also hypothesized (okay, wondered) what science (data) was used to shut down Toronto bars & restaurants & gyms. 

My upspoken hypothesis was that "no data was used". It was more "the squeaky wheel gets the grease" theory.  In that Toronto's Medical Officer of Health, Dr. Eileen Devilla.....


....who - based on science - had been pleading with the Ontario government's Chief Medical Officer, Dr. David Williams, to shut everything down. 

Well, the government just released the information they used to shut the bars & restaurants & gyms.

And guess what?


No data.

In fact, it was have been the opposite of using data.

So let's look at the "data".  And by data, I mean the data from this article, as I don't have access to the report.

The report looked at Toronto between August 1st and October 24th, although bars & restaurants were shut down Oct 9th.  There were reported 27 outbreaks (outbreak meaning more than one case reported) at Toronto's restaurants.  So that is 27 events over 9 weeks, 3 per week.

For 7,500 restaurants!

So for the 0.3% (27/7,500) of the restaurants that had cases, they shut them all down.  Talk about bringing the hammer down.

So have those restaurant lockdowns brought the rate down?


You be the judge. So I'm guessing the medical folks never used any data - or science - to begin with.  

Knew it all along!

So now that this report has come out, Ontario's Premier, Doug Ford, is telling the medical folks to go back to the drawing board to come up with some alternatives.


Here's one; shut down the 0.3% of violators and leave the rest alone!  In fact, bringing the hammer down on the violators will keep the rest on their toes.

And me in my cups!  Cheers!


Friday, 30 October 2020

Bringing Down The Hammer!

 So this...er...street entrepreneur...


...was just sentenced to 13 years for attempted murder of trying kill another...street entrepreneur.  

Except this was at a Scarborough playground.


However, although he shot at the guy ten times, he missed (can anybody be a street entrepreneur?) but did hit a five year old girl in the stomach and her nine year old sister in the leg.

The Crown wanted 15 years, but the judge said there were mitigating circumstances. T'Quan expressed remorse.  So he gave him 12 years.

But then the hammer came down. An aggravating factor (in addition to the fact of shooting wildly with 11 kids on the playground - mitigating factor; he only hit two) was that he was under a 10-year firearms ban at the time of the shooting and had eluded police for two years.

So the judge looked right at him and said, "Ha ha, mister, now it's a lifetime ban!  Yeah! You want more?  You want more?"

So maybe he didn't say that, but he did give him the lifetime ban. I'm sure his jaw dropped when he heard that.  "You've outfoxed me this time, judgeman!"


And what was the first judge thinking, with the ten year ban? That ten years is long enough to be without a gun?  Especially for a gangbanger - I mean street entrepreneur? Or he'd forget how to use it? 

Anyway, sentenced to 12 years, but with our parole eligibility, he'll be out in four.  Remember, he expressed remorse.

The message here? Don't mess with the Canadian judicial system!  Because after you try and kill somebody, you'll be looking at four years before you can try and kill him again.  With no gun this time! Unless you steal one, of course. But we've got that covered, too - you're not allowed to, mister!   Yeah!


Thursday, 29 October 2020

So What The Hey Is Going On In Toronto?

As advertised yesterday, let's drill into the evil Toronto covid-19 numbers. Looking at yesterday's chart, things aren't looking good for the largest city in Canada (and fourth largest in North America).

[As always, click on any graph to zoom in.]

Toronto is way, way over the Government's new "7-day case rate/100,000 population" target of 25 .

So who are the bad actors?

Here is a chart of Toronto neighbourhoods, showing recent case rates/100,000.  The legend is, the darker the blue, the more poo-poo.


So let's drill into some of these darker - and lighter -neighborhoods.  Definitely zoom in on this one.


So #1 is Mount Olive (upper left corner), coming in at an astonishing rate of 285.  More than ten times the government target!  

The City of Toronto describes Mount Olive as a culturally diverse community.  So lots of large families living in small apartments/townhouses. 


Similar descriptions for other three, Dorset Park a "Priority Neighbourhood" and St. James Town is Canada's most densely populated neighbourhood and Oakridge is also described a culturally diverse.    So a lot of similar themes here. And they are all well over the target.


But let's look at some of the lighter coloured neighbourhoods.  And at the risk of being politically incorrect, it is not just lighter colours on the map, ahem....

For those that know Toronto, favourable addresses can be found throughout The Beaches, Rosedale and Lawrence Park (highest income per capita in Canada - $622,000).

But everybody knows Rosedale, so lets look at that.


Last week there were seven Covid cases in Rosedale. With Rosedale's population of about 20,000, that would mean 7 cases per 20,000.  To compare that to the government's stats of "per 100,000" you would multiply by 5 (5 x 20,000 = 100,000).  

So Rosedale's rate would be...hmmm...carry the five, hmmm...subtract the hmmm....okay 7 x 5 = 35 (33 with some rounding).

What?  33?  Rosedale is over the government's lockdown target!  Rosedale?

And that is only 7 cases in a week.  One per day, for 20,000 people and they are over the target!

That is one tough target.

And that's all I have to say......


Are you still there?  Actually, I have a lot more to say, but....nevermind.....


Wednesday, 28 October 2020

What A Bunch Of Turkeys

Another day, another new high for the 7 Day Case rate in Canada.  [As always, click on any graph to zoom in.]


"Experts" are saying this is likely due to large family gathering during Thanksgiving.  As virtually all provinces are seeing increases.

[School re-openings are another very likely culprit.]


Alberta & BC especially.  Although Ontario is certainly a contributor.


And by Ontario, of course, I mean Toronto.  Here is the chart of Toronto, with case rates shown per 100,000 population. [Seems fanciful thinking that rate will get back to 25 in a week.]


So how are those bar closures working for ya?  Really seemed to have done the trick.

But more likely, as mentioned above, the result of coturkdiots (is that like turduken?) gobbling up, well, turduken.

So to test that theory, let's look at other Ontario regions that have not had their bars & restaurants & gyms & movie theatres closed.

Here is a previous chart showing the Ontario regions.  Virtually all the of the Greater Tornoto Area (GTA) and Ottawa are above the golden 25 limit.


So based on the positive comments when a similar chart was shown last week for global changes [okay, no positive comments, but no negative ones either! Okay, no comments at all.] here is the same Ontario chart, but adding in data from a week later.

It is more complicated but the dark blue is recent data and light blue from last week.  You really need to double click this one.


So the rich keep getting richer and the sick (the GTA) keep getting sicker, one week later.  Is it due to Thanksgiving?

The GTA have had their bars & restaurants closed.  What about regions without restrictions?

Like anything with "science" it's not cut and dried.  

Some smaller regions near the bottom (North Bay, Haliburton, Thunder Bay, Hastings, Guelph, Haldimand, Peterborough, Sudbury) have all seen increases.  So restaurants aren't a factor there. Gobble gobble.

But others - where the light blue line is longer than the dark blue - (Ottawa,  Hamilton, Waterloo, London, Windsor) have all seen decreases.

The link among these? They are all university towns.  At whom everybody was pointing fingers as ignoring Thanksgiving "please stay home" orders.

So, science has spoken! There's no conclusion.

Stay tuned for tomorrow, when we drill down into where the hey in Toronto are all these case increases coming from.  We gotta get to the bottom of this and get those bars & restaurants back open.

[Full disclosure, Arnotti Thoughts is sponsored by the Toronto Bar & Restaurant Association.]

Well, it should be!


Tuesday, 27 October 2020

Not Too Shabby

It's (usually) nice when Canada gets recognized on the world stage.  

Or in this case, in the latest Sasha Barat Cohen's "Borat Subsequent Moviefilm".


The scene pans to Barack Obama, and Borat states that since Obama was elected President of the United States, many Africans have become world leaders.


Ouch!  But hilarious.

So what else has our African Prime Minister been up to?

Well, the International Monetary Fund (IMF) has just released their 2020 Fiscal Monitor Report.


This report reviews the fiscal responses of world governments to the Covid-19 Pandemic crisis.

The report shows that all governments have been shoveling money out the door, but evidently Trudeau has been using the largest shovel.  In the world.

Canada leads the world is virtually every category.  And by "lead" I mean the highest % GDP spending, debt, fiscal imbalance and other categories I've never heard of.


But I don't have to worry about paying it back.  The people who will be paying it back - and they will be paying it back all their lives - are currently all under the age of four.

"No way!" adherents of Modern Monetary Theory say;  "Governments never need to pay it back.  And with current interest rates, borrowing is essentially free."  And for people of a certain age, low interest rates are all they have ever known.

But for people of a different certain age, they remember back to the early 1980's.  Where after years of government spending to get us out of recessions.....


...inflation exploded and interest rates spiked to above 20%. 

And when that happens - and it will - interest payments will become unmanageable.

You need look no further back than Greece in the same 1980's. 


Year's of government overspending led to soaring inflation, high deficits and, finally, defaulting on loans to the IMF. [The first time in history that a developed country defaulted on an IMF loan. Which may be why the IMF publishes these reports.]

And with the progressive left about to take over in the US.....


...Trudeau will have lots of company in the Home Depot shovel aisle.


Sunday, 25 October 2020

"It's An Ill World After All"

 In spite of what the Canadian Public Health Authorities would have you believe, Canada is doing not too badly in the global view of covid cases.

Here is a chart from a week ago showing countries' weekly covid case rates.  Weekly, rather than total rates, being an indication of which countries are experiencing the worst outbreaks right now.

[As always, click on any graph to zoom in.]


European countries in yellow dominate the hit parade.  Czechia leads the way, with a rate of 737.

Canada, in red, is well down the list.  Even the US is only 11th.

The next chart compares rates a week later; comparing the Oct 18th data (above) with yesterday's weekly rates.


The chart is a bit complicated, but to highlight some points;

  • Czechia still leads the pack, but now its rate has increased from 737 to over 900.
  • Eight of the top nine countries are in Europe, with virtually all seeing an increase in rate.
  • Canada still well down the list, with our rate essentially unchanged.
  • The US still at 11.
  • China still at the bottom, at zero. Boy, can those totalitarian states really get their people to toe the line!
So what about Canada?  Our rate of increase has leveled off somewhat.


At least compared to what it was three weeks ago.

So who cares about Canada - what about Toronto!!

This is an updated chart showing 7 days case rates, with Ontario's "lockdown" target of 25 cases per 100,000 population (most of the world uses per million population).


The Toronto case rate continues its upward march seemingly unabated.

So two offsetting events took place about this time. Toronto closed its bars and restaurants on Saturday, Oct 10th, and the (super spreader?) Canadian Thanksgiving occurred at the same time.  

From my read. closing those bars and restaurants didn't do anything to quell the outbreaks.  In fact, maybe mitigated the impact of Thanksgiving.  [Said the guy who frequents bars more than Thanksgiving tables.]

I'm betting on Thanksgiving as the culprit, as stories from university campuses - in spite of health officials pleading with people to stay home, specially asking university kids to not go home - according to one pundit, campuses looked like Grand Central Station.


I guess some people felt those restrictions were meant for...other people.


So the question is, if rates keep rising, what trigger can governments pull next?  Putting a few more regions into lockdown?  Putting all regions into lockdown?

That certainly seemed to work in June and July.

The only thing preventing that is can people be trusted to do the right thing?


Ah, what does he know.


Friday, 23 October 2020

"We've Still Got A Long Way To Go"

Toronto has been moved back to a modified Stage 2 for Covid-19 purposes; bars and restaurants, gyms & movie theatres are closed.

Why?

Because according to the tall foreheads in our public health department, Toronto is over the (recently made up) target of a "7 day case rate per 100,000 population" of 25.

Toronto was "moved back" for 28 days.

So how we doing...?


We are 14 days into the 28 day rollback, without a lot of results. So as my favourite rocker from my salad days, Alice Cooper, used to sing..."We've Still Got A Long Way To Go".


In fact looks like Toronto is going in the wrong direction.   

Let's hope they turn around fast, or Premier For may be saying "No More Mr. Nice Guy!".